
Alerts, jobs, model analysis
Alerts
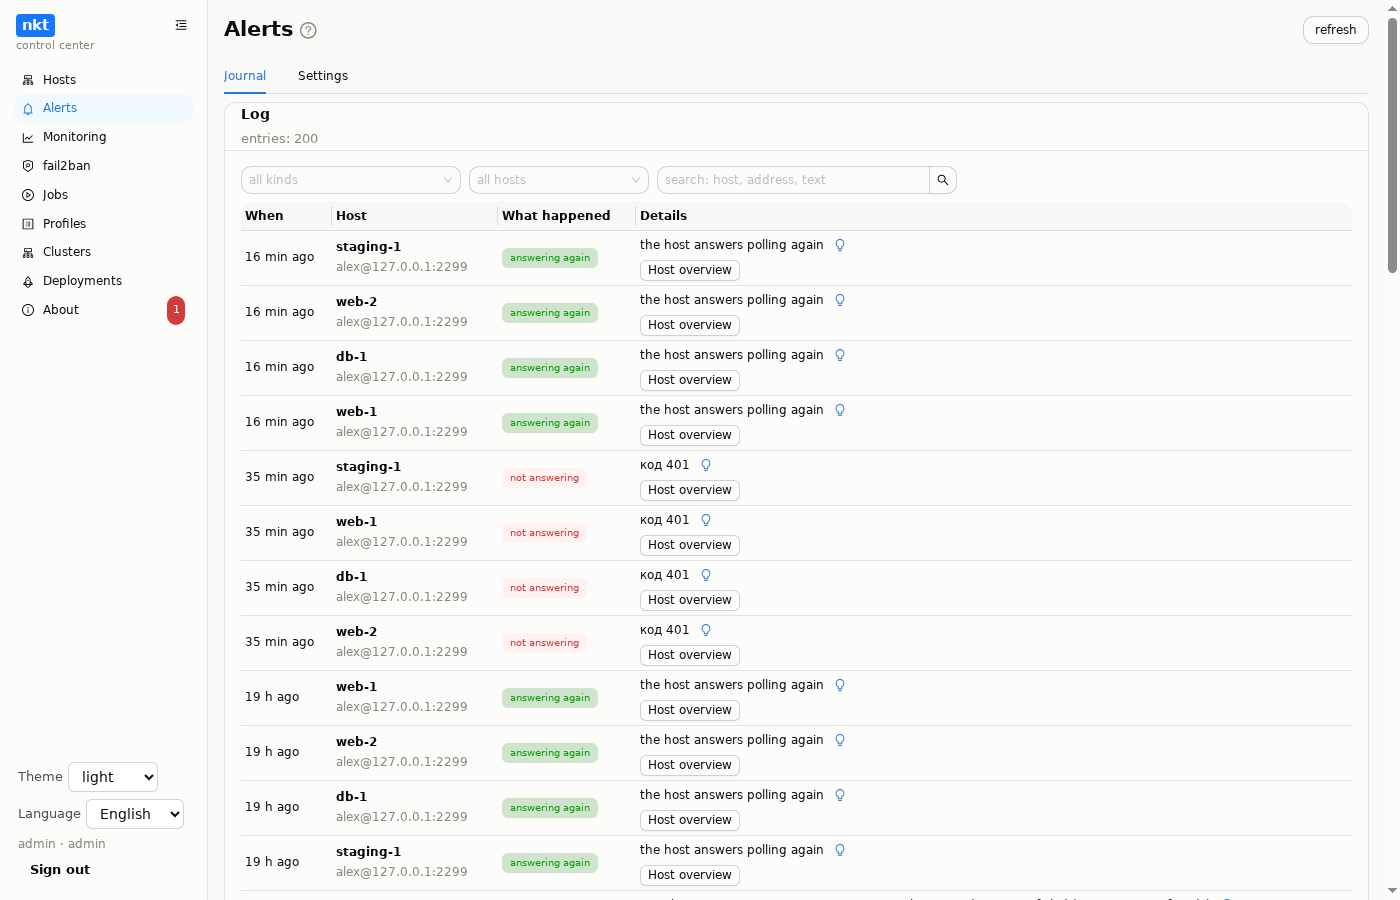
The hub notices transitions itself: a host is down / back, rebooted (its uptime dropped, which only happens after a boot), serious findings appeared / were fixed, a job failed, fail2ban banned new addresses, a “Monitoring” forecast, the host's UPS: power lost / power restored, battery low, no link to UPS (see UPS). An alert log with settings for what to record and what to notify about; short episodes (“down” → “back” a couple of minutes later) collapse into one line “was down for N min”.
The section has two tabs: "Journal" (always opened on entry) and "Settings": what to record, notify about and hide, outgoing webhooks, and the Telegram and Slack bots.
The third settings column is "hide": the kind is recorded but not shown in the log and not counted as unread; hidden kinds cannot notify. Above the log are filters: by kind (several at once; the list of kinds comes from the hub, all of them, “forecast” and “rebooted” included), by host, and a search by host name, address and event text, run over the whole log (the latest 2000 events) rather than the page on screen; the "show hidden" checkbox brings hidden kinds back. The filter is remembered in this browser.
A host event has a button that goes straight to the right section of that host with the item highlighted: new findings open "Findings" with those findings' cards highlighted; new bans open fail2ban with the banned addresses highlighted; a forecast opens "Disks" (the mount point), "Containers" (the engine tab and the container's row) or "Availability" (the target); unreachable, back online and rebooted open the host overview. Events recorded before this version have no link of their own — the button goes to the section matching the event kind. "Monitoring" hints use the same links.
Every external IP in an alert's text gets its own bulb: an AI check of the address and a “Ban on all hosts” button in the answer window, see fail2ban.
The “Notify on problems” switch turns on browser notifications — they arrive in any hub section while the tab is open. The unread counter is on the menu item.
Outgoing webhooks: the hub sends the same events (and deployment outcomes) out by itself, to n8n, a chat bot or your own system, with an HMAC signature. See Outgoing webhooks.
Monitoring
Availability and load of all hosts, Kubernetes nodes, trend forecasts and hints are on their own page: Hub monitoring. Forecasts arrive as “forecast” alerts (see above); their thresholds are set there.
Hub jobs
Installing and updating nkt on a host (including “update all”), creating a machine, applying a profile to a group, a script, a cluster — all of these are hub jobs with a live log; a job interrupted by a hub restart resumes. A failed job has “try again”: a new job with the same parameters continues from the saved state (created machines, the tunnel, installed roles are skipped), the old log stays. Job logs, titles and errors, like alerts, are shown in the reader's language — a job started from a Russian UI reads in English for an English user; raw tool output stays as is. The list has filters by state and kind, a text search, pages and date order, like the alert journal (see the host's Jobs).
A job that resumes after a service restart remembers how many times it was resumed: if the service restarted in the middle of it more than three times, it stops with an error instead of looping. An error inside a job runner doesn't crash the service — the job ends with "internal runner error".
Export, updates, cache
- Hub export and import — on the Hosts page.
- Updating the hub and hosts, the beta channel, the vulnerability and ClamAV databases — Updates.
- The package, file and image cache — Package cache.
Model analysis (AI)
A card in "About" — one setting for the whole installation: the provider (Anthropic or OpenAI-compatible, local ones included — Ollama, vLLM, LM Studio), address, model, key. The key is stored encrypted on the hub and never handed out; requests go from the hub — hosts need no internet. Off by default.
The model is picked from the provider's list: the Get models button next to the field asks the provider for its list using the address and key currently in the form (Anthropic: /v1/models; OpenAI-compatible: /v1/models, plus /api/tags with the model size for Ollama). The field turns into a searchable list: name, release date or size, newest first. OpenAI's embedding, speech and image models are hidden; the "show all" checkbox brings them back. You can still type a name by hand; if the current model is not in the provider's list, a mark appears next to it. After picking from the list the window offers to Test right away. The list is free: it does not use the daily limit, and the request is written to the audit log.
Enter the API address the way the provider gives it: with /v1 at the end (http://server:8080/v1 for llama.cpp and LM Studio, https://openrouter.ai/api/v1) or without; the hub appends the paths itself and does not double /v1. A provider error names the request address, so a wrong address is obvious right away.
The Test button sends the model a short probe using whatever is in the form right now: a wrong address or key shows up immediately. Answer wait time is how long to wait for the model (90 s by default; a local model on a weak machine needs 300+); the analysis window shows a running seconds counter.
When on, a bulb button appears in the row of a finding (including "What's broken" on the overview), a vulnerability (packages and images), a malware hit (both heuristic hits and ClamAV findings), an alert and next to a job error: what it means, why it matters here, what to do — with commands. Commands are only shown; you apply them.
The "Resource map" page gets an architecture review: single points of failure, needless exposure, inconsistencies, where to start; on the hub — across all hosts at once. Reviews are kept with their date.
The answer stays with the finding: a bulb without an answer is outlined blue, one with an answer is orange and opens the saved answer without a request ("ask again" and "delete answer" sit under the answer). The same finding already analysed on another host is filled blue: that answer is shown first with a note where it came from, and a request for this host is a separate button.
Model instructions (prompts) are edited in the same card: for finding analysis, the architecture review, configuration help and the external address check, in Russian and English; saving goes through a window with a diff against the default, "restore default" removes the edit.
In "Configs" every open file (any service) and the selected program have a bulb: "what is configured / what to fix / example", with a field for a task-specific question. Passwords, keys, tokens and password hashes are always cut from the text.
When writing a configuration fails (validation or apply), the failure banner carries the same bulb: the model gets the check output and the diff of the edit, with the task to explain and show a corrected fragment. Passwords, tokens and keys are always cut from the request, regardless of the checkbox below.
The "hide addresses and names" checkbox (on by default) replaces host names, IPs, domains and e-mail with aliases before sending and puts them back in the answer. Answers are cached and spending is capped by a daily limit.
Under the answer there is "Generated by …" with the model name and "show request": the whole request as it went to the model: to whom (provider, model, address, wait time), the instruction (default or edited), the message with aliases instead of addresses and names, and a "what was replaced" table (admins only), plus a "copy the request" button. The request is stored with the answer, and with the resource map architecture review too, including the review history. Answers received before v1.11.41 keep only the message.
Privacy mode
The “hide sensitive data” checkbox in “About” — for screen sharing and screenshots: addresses and names of hosts and machines, users, keys and tokens, domains, cluster API addresses, IP/MAC are blurred on every page and in modal windows; in logs, alerts, findings and audit — addresses, e-mail, domains and the host names from the list; terminal, logs and topology — as a whole. Nothing shows on hover — turn the mode off to read. The mode mark is the orange “nkt” badge in the header; the state is remembered in the browser.