
Overview, findings, resource map
The first menu sections answer the main question: what is really going on on the host and what is broken. The nginx, haproxy, caddy, docker compose, firewall configs and certificates are parsed and checked against the live state — ss output, iptables counters, running containers, a real TLS connection to the socket.
Overview
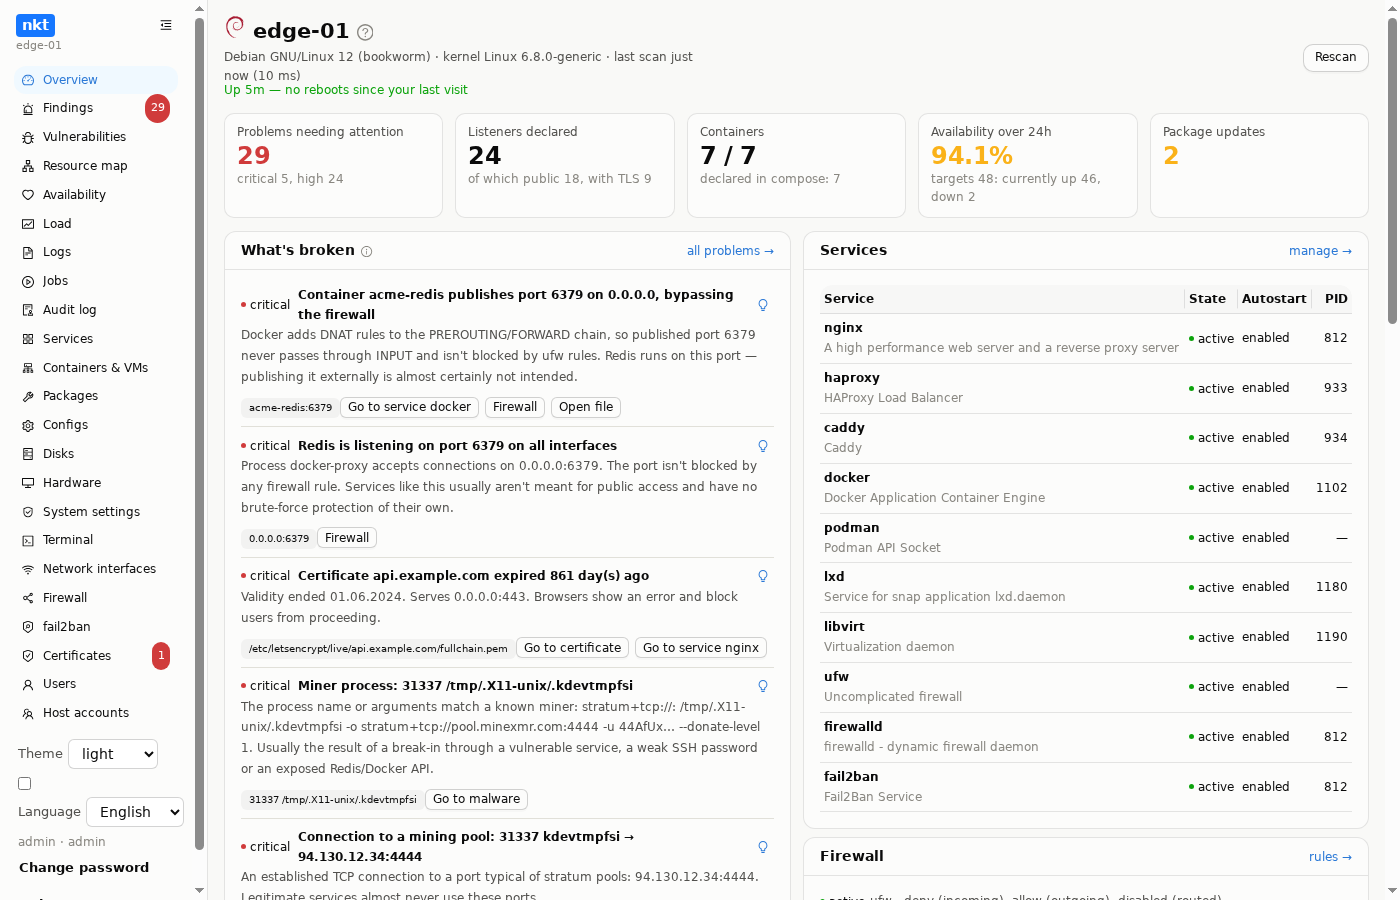
- Summary: OS, kernel, uptime, load, memory, disks, network.
- Uptime under the summary: "Up 27d 4h". Green — the machine has not rebooted since your last visit (uptime grew by exactly the elapsed time), red — it has (uptime dropped). The previous value is remembered in the browser per host name; the hub records an alert about a reboot on its own.
- Counters: findings by severity, declared and public listeners, containers, availability over 24 h, package updates. Each leads to its section.
- What changed since your last visit — new and gone findings, services, containers, certificates: open it in the morning and see what happened overnight.
- Helper packages (htop, ncdu, jq, tmux…) with an “installed” mark and one-click install.
- “Rescan” — a fresh scan right now, without waiting for the schedule.
Findings
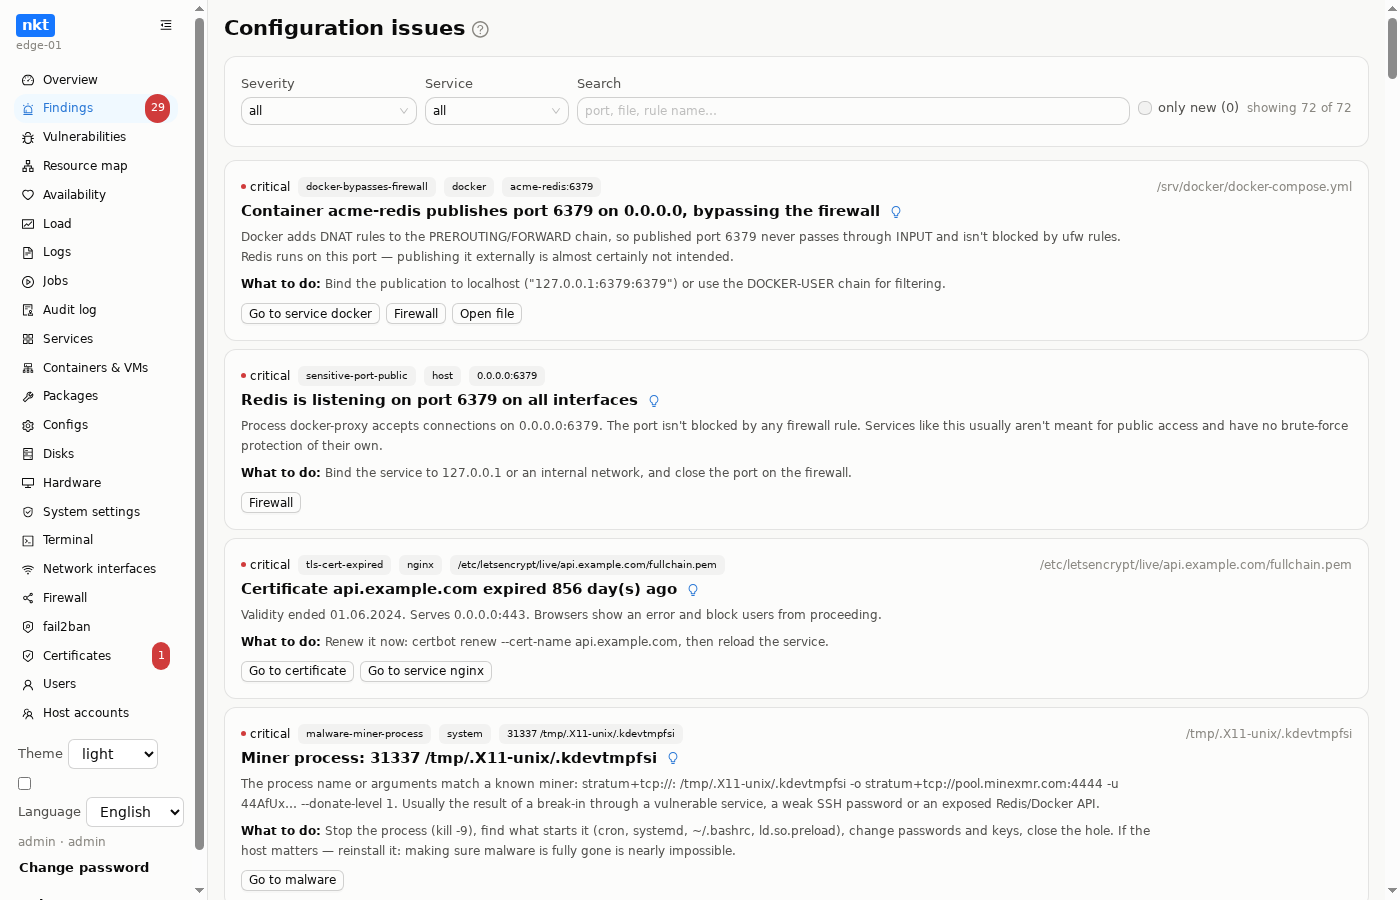
Every finding has a severity, a plain-language explanation, the file and line, a concrete fix and links to documentation. Search and filters by severity, service and text.
Below a finding are buttons that take you where it gets fixed:
- Open at line N: the file in "Configs", with the line highlighted and scrolled into view;
- Go to certificate: "Certificates" with the certificate's row highlighted; "Renew" there runs with a live certbot log;
- Logs, Restart, Start: for a container in a restart loop or not running; logs open in a window, start and restart ask for confirmation and show a live log, as in "Docker" (admins only, with actions allowed);
- Firewall: for a port open to the internet, Docker or Kubernetes bypassing the rules, a stale rule;
- Port N in Firewall and On the resource map: for an undeclared listener; "Firewall" highlights the rules and the socket of that port, the map opens its node (or the folded service it belongs to);
- Go to malware: the "Malware" tab in "Vulnerabilities" with the finding's card highlighted; Open in files: the "Disks" file browser on the file's row (when the file is under a browser root);
- Fail2ban: for fail2ban findings;
- Go to service nginx (haproxy, caddy, docker, fail2ban…): "Services" with the service's row highlighted; Go to container: "Containers" with the row highlighted.
The same buttons appear on each finding in "What's broken" on the overview.
What is checked:
- Network and firewall — port conflicts, “declared but not listening”, “listening but not declared”, no default deny, a public port blocked by the firewall, a Docker container publishing a port around ufw, stale rules, Redis/PostgreSQL/MongoDB on all interfaces.
- TLS — weak protocols, no HSTS, certificate not set, expired, expiring, not yet valid, unreadable, not covering the name, not renewed automatically, an orphaned certbot lineage, self-signed, a weak key, the service has not reloaded the certificate (the socket serves something else than the disk), a plaintext HTTP proxy.
- Pools and containers — an undefined or unused upstream, a backend not listening, all backends disabled, a single backend, no health check, a container in a restart loop, not running, not declared, without a restart policy, the haproxy stats page without a password, a docker daemon without the client (Debian 13: docker.io without docker-cli).
- Kubernetes (on a control plane) — a pod in CrashLoopBackOff or ImagePullBackOff, a pod restarted within the last hour, a long Pending, a NotReady node, a Deployment or StatefulSet missing replicas, a stuck PVC, an expiring API server certificate, pods with privileged/hostNetwork, NodePort and LoadBalancer ports past the firewall; containers without limits, images without a version, cluster-admin for ServiceAccounts and people, namespaces without a NetworkPolicy.
- Profile drift — when a profile is applied to the host, deviations from it show up here too.
The full list of rules with their codes is below.
Vulnerabilities
CVE scans via trivy: the host's installed OS packages, packages inside LXD instances and libvirt machines (directly for LXD containers, via lxd-agent for LXD VMs, via qemu-guest-agent for libvirt machines) and Docker/Podman container images, and on a Kubernetes control plane the images of every pod in the cluster (from the node's containerd or straight from the registry). Each finding shows its origin in the list, a pod image also the pods it runs in. trivy installs itself on the first scan, the vulnerability database is downloaded automatically (or taken from the hub, which keeps one for all hosts). The list: severity, package, fixed version, links; the scan progress is live.
The "by danger" order (the default) puts first what can be reached from the network, then sorts by severity, and among equals puts first what an update fixes:
- the "Network" column shows the ports through which the vulnerable code is reachable: a service from the OS package listens beyond loopback (the package owns the listening process's binary, by
dpkg -Sorrpm -qf), or a container with this image publishes a port not on 127.0.0.1; - the "only reachable from the network" and "only with a fix" filters;
- the "by severity" order is the previous one, without the network.
Libraries (such as libssl inside nginx) are not linked to services yet: a vulnerability in one is ordered by severity, without the "network" mark.
Each row leads to where it gets fixed: To package opens "Packages" filtered by name with the package's cell highlighted; To containers opens "Containers" with the rows of containers running that image highlighted.
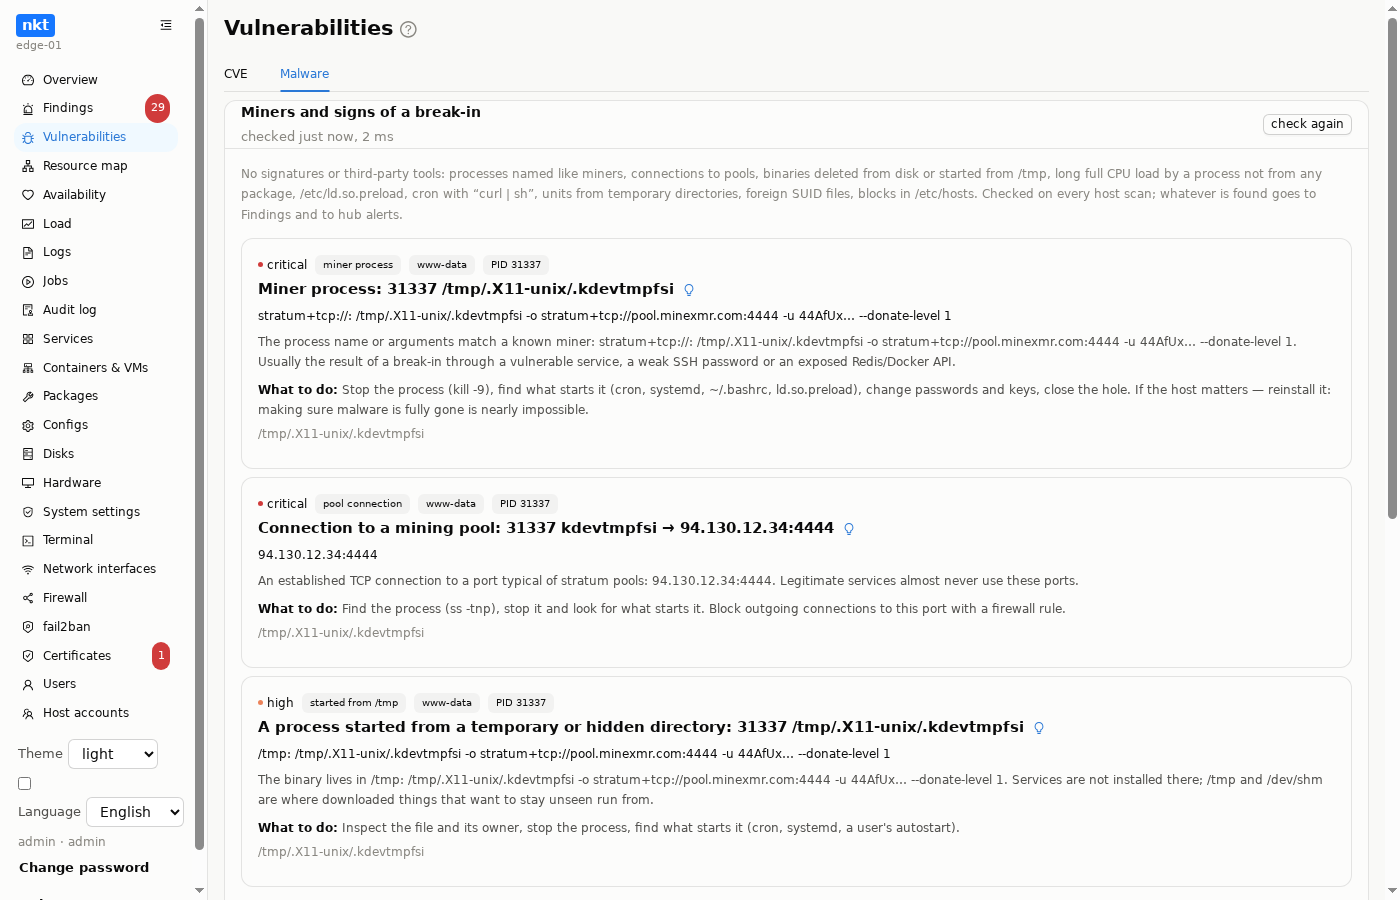
The “Malware” tab — a check for miners and signs of a break-in with no third-party tools (processes named like miners, pool connections, binaries from /tmp or deleted from disk, cron with “curl | sh”, units from temporary directories, foreign SUID files, /etc/ld.so.preload, blocks in /etc/hosts) on every scan, and below it ClamAV: install, signature database, scans of host directories and container images, quarantine. Each hit has buttons: a file opens in the "Disks" file browser on its row (when it is under a browser root), a file in /etc in "Configs", a container in "Containers".
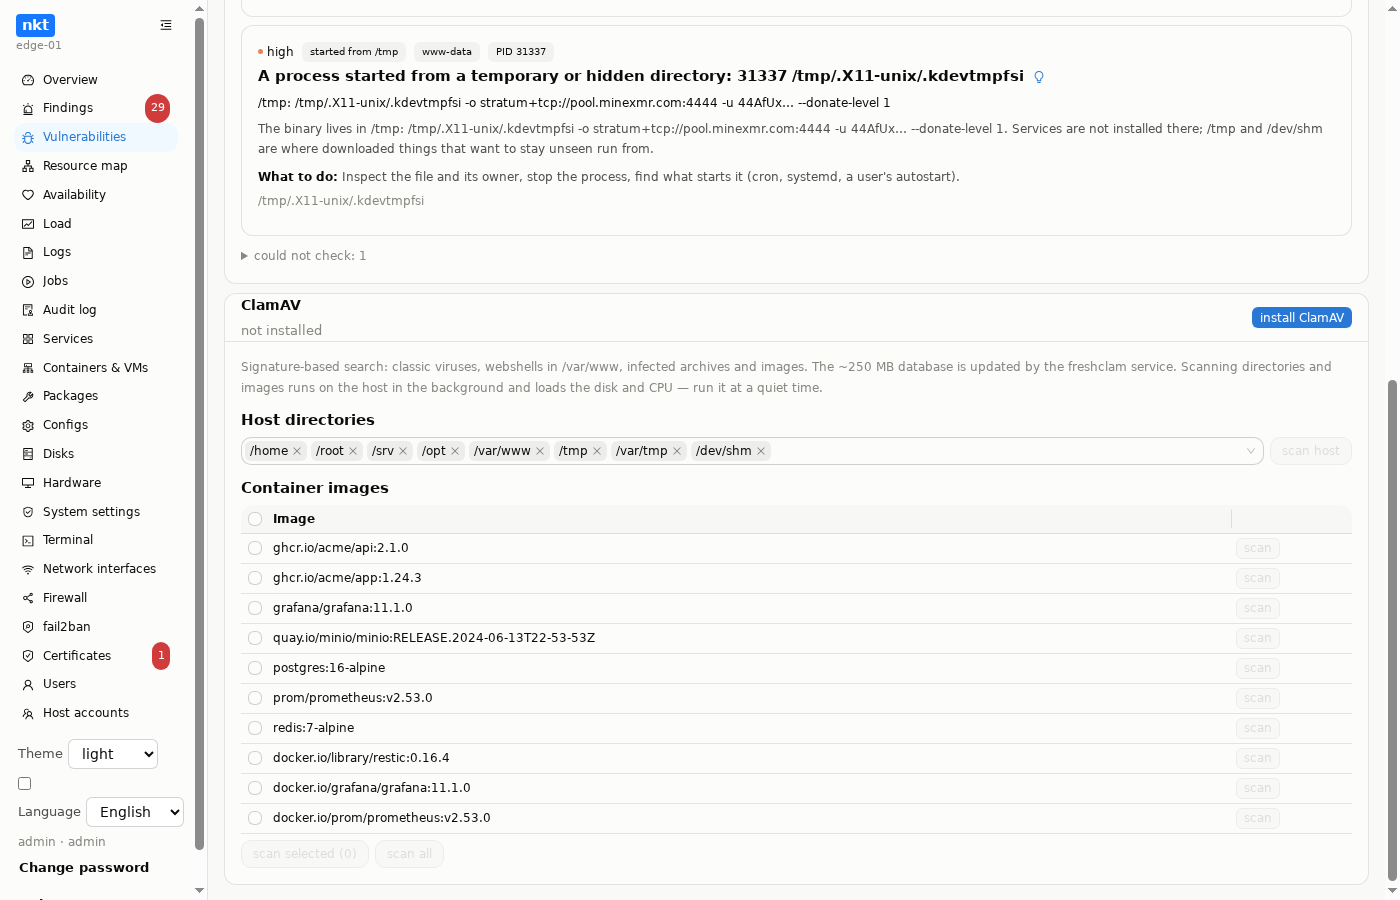
Installing ClamAV, updating its database (freshclam) and scanning run as host jobs, one at a time: starting one opens the standard job log window, and while it runs the card shows what is running with Log and Cancel buttons. Cancel also stops clamscan itself (with systemd, the whole transient unit), and an image unpacked for scanning is removed; the previous scan result stays. Any job can also be cancelled from its log window with Cancel job.
Resource map
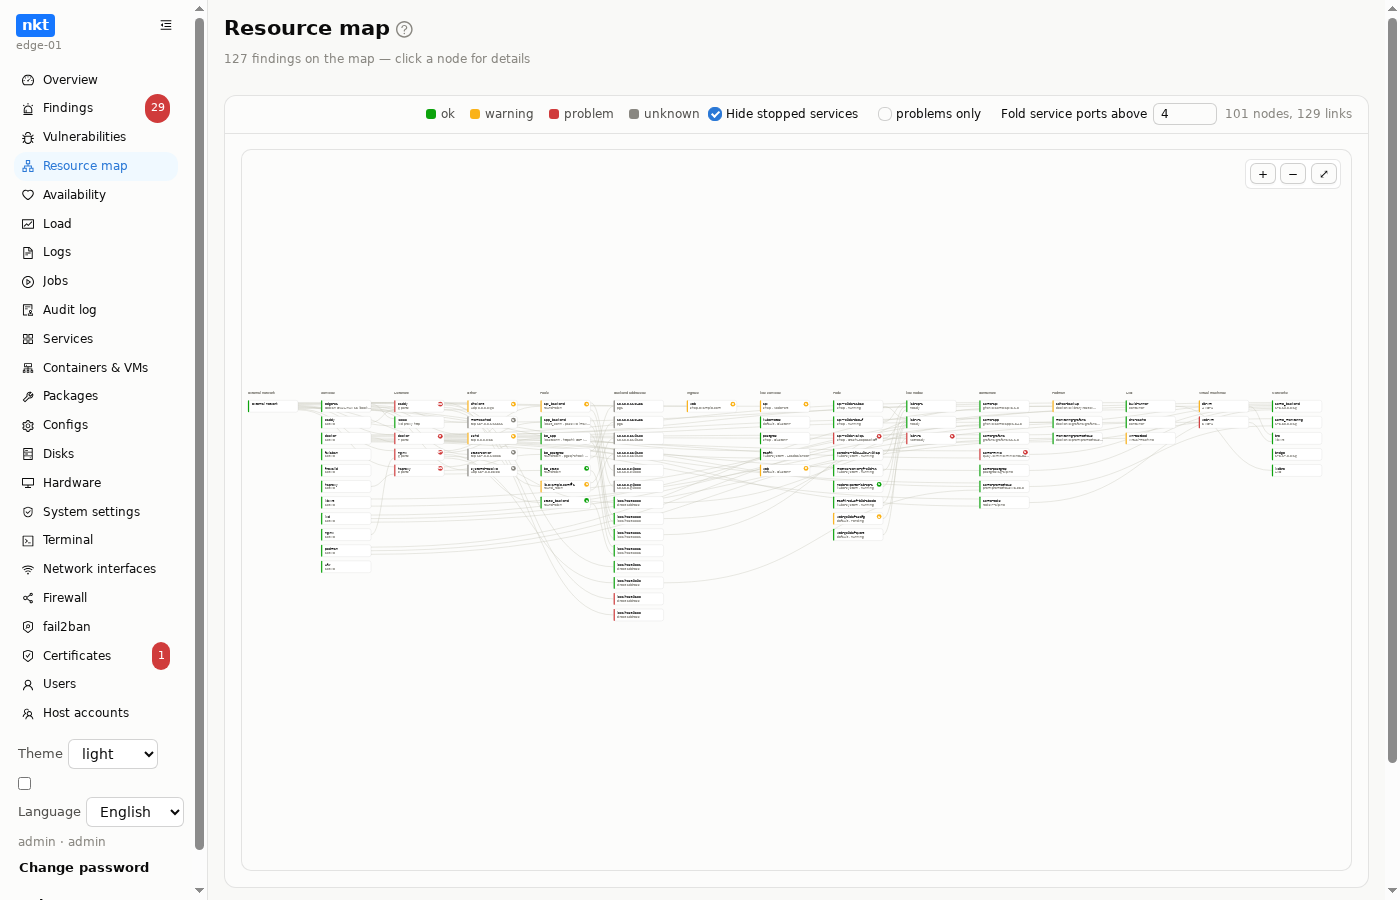
A graph where traffic reads left to right:
external network → service → listener → pool → backend → container or machine → networkEdges come from the configs (proxy_pass, upstream, use_backend, published ports), node state from live listeners, containers and findings. The column layout stays stable between scans; zoom and drag with the mouse, link highlighting on hover. A click on a node opens a window with its details: kind, state, the node's findings and all its parameters in full; it also has a button to whatever is responsible for it: a service opens "Services" with its row highlighted, a listener or pool its config, a Docker or Podman container its row in "Containers", LXD, machines and Kubernetes their tab, a network "Network interfaces", an undeclared listener "Firewall" with the rules of its port highlighted.
The map drags with the mouse at any zoom; label text is not selected while dragging, and releasing after a drag does not open the node under the cursor.
Ports of one service are folded. When a service (nginx with a dozen server blocks, a process with many ports open) has more listeners than the threshold, the map shows them as one node "nginx · 12 ports" carrying the edges of all of them. The threshold sits in the row above the map next to the checkboxes ("Fold service ports above", 4 by default) and is remembered in the browser. A click on a folded node opens a window listing its ports: each with its state, finding count and a button to where it is configured (the listener's config, the port in "Firewall"); Expand on the map shows the service's ports one by one.
libvirt machines and LXD instances are linked to their networks (a libvirt bridge, an LXD network) and to backends pointing at their address — you see which site lives on which machine. Forwarded LXD ports are an entry from the host into the instance. A machine node's details show its address, ping, current CPU and memory and the vulnerabilities of its packages; no ping reply turns the node red, critical vulnerabilities turn it yellow.
A Kubernetes cluster (on a control plane) has its own columns: Ingress → Service → pods → cluster node, and the node is linked to the host machine it runs on. A service with no pods and an Ingress pointing at a missing service are highlighted.
Rules and codes
Every finding comes with an explanation, a link to the file and line and a concrete action. The codes are visible in the API (/api/findings) and in nkt scan.
Network and firewall
| Rule | Severity | What it finds |
|---|---|---|
port-conflict | high | Two services declare the same port on overlapping addresses |
declared-not-listening | high | A port is described in a config, but nothing is listening on it |
listening-not-declared | medium/info | A process listens on a port not described in any config |
no-default-deny | high | The INPUT policy is ACCEPT and ufw is off |
public-port-blocked | medium | A service listens on 0.0.0.0, but the firewall blocks it |
docker-bypasses-firewall | critical/high | A container publishes a port on 0.0.0.0 — DNAT bypasses INPUT and ufw |
stale-firewall-rule | low | A rule allows a port nothing is listening on |
sensitive-port-public | critical/high | Redis, PostgreSQL, MongoDB, etc. listening on all interfaces |
TLS and certificates
| Rule | Severity | What it finds |
|---|---|---|
weak-tls | medium | TLSv1 / TLSv1.1 left in ssl_protocols |
missing-hsts | low | A TLS server doesn't send Strict-Transport-Security |
tls-cert-missing | high | listen ... ssl with no ssl_certificate |
tls-cert-expired / -expiring | critical / high-medium | Expired, or expiring within 7–30 days |
tls-cert-not-yet-valid | high | Not yet valid — usually the host's clock is wrong |
tls-cert-unreadable | high | The file a config points to can't be read |
tls-cert-name-mismatch | high | The certificate doesn't cover the name the server answers as |
tls-cert-renewal-not-automatic | medium | certbot knows about the certificate, but neither a timer nor cron will renew it |
tls-cert-orphan-lineage | high | Sits in /etc/letsencrypt/live, but has no renewal config |
tls-cert-self-signed / -weak-key / -weak-signature | low / medium | Self-signed, RSA shorter than 2048, or a SHA-1/MD5 signature |
tls-cert-not-reloaded | high | The socket serves a different certificate than the one in the config — the service hasn't reread the file |
public-plaintext-proxy | medium | A public HTTP listener proxies traffic with no encryption |
Pools and containers
| Rule | Severity | What it finds |
|---|---|---|
upstream-undefined / -orphan | high / low | A route references a pool that doesn't exist; a pool is declared but never used |
upstream-member-down | high | A pool's local backend isn't listening on its own port |
all-backends-disabled | critical | Every server in a pool is marked down/backup |
single-backend / backend-no-healthcheck | info / medium | No redundancy; no health check with multiple servers |
container-restarting | high | A container stuck in a restart loop |
container-not-running / -undeclared / -no-restart-policy | medium / low / low | Declared but not running; running but not declared; no restart policy |
admin-interface-open | high/medium | haproxy's stats panel is reachable with no password |
malware-* | critical–medium | A miner in processes or a container, a pool connection, a deleted/temporary binary, ld.so.preload, cron “curl | sh”, a unit from /tmp, a foreign SUID, blocks in /etc/hosts |
docker-cli-missing | medium | The docker daemon runs but there is no docker command (Debian 13: docker.io without docker-cli) |