
Availability, load, logs, jobs
Availability
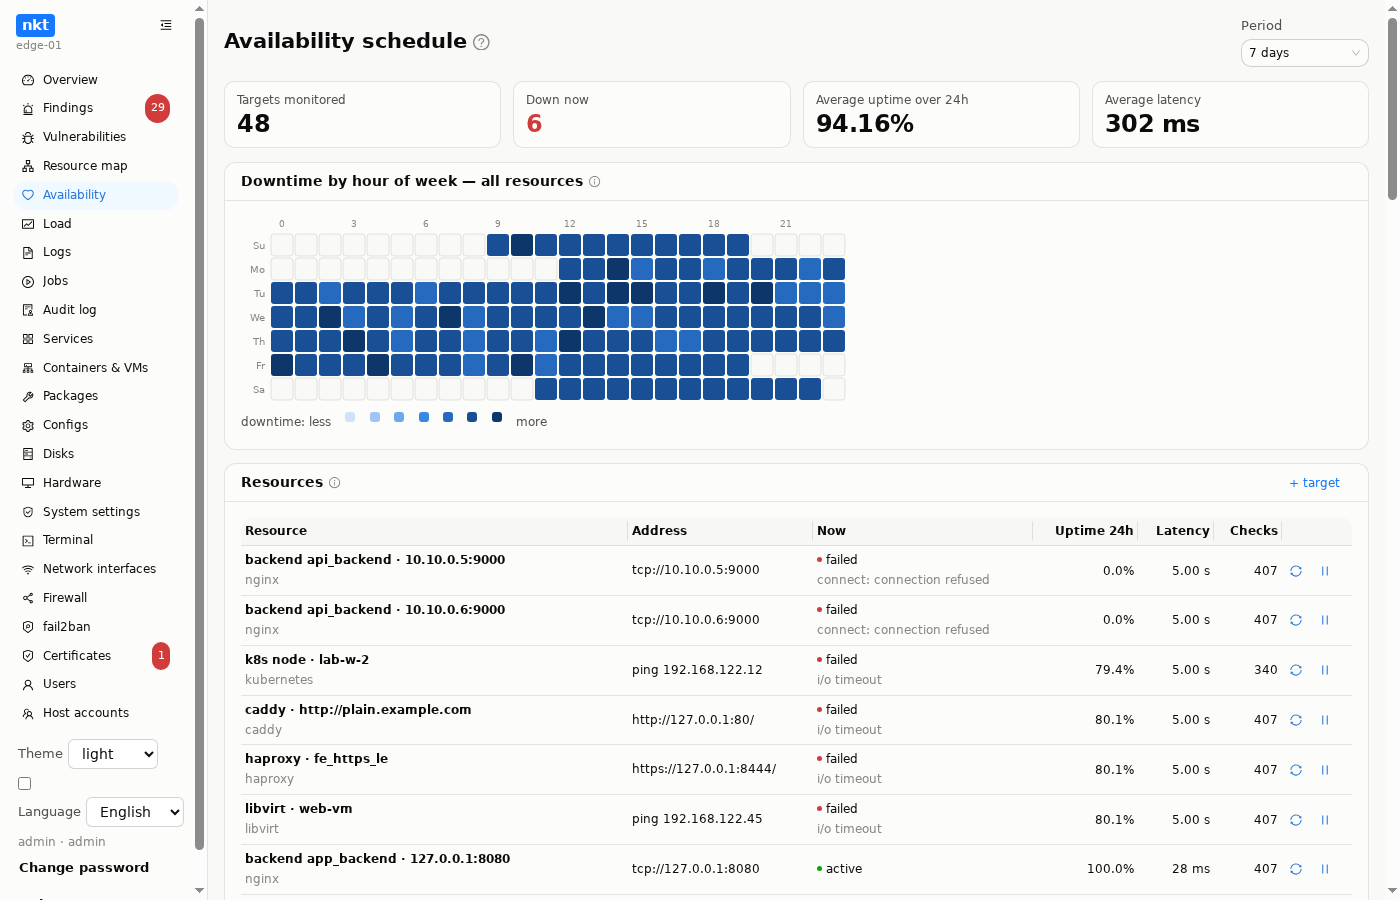
On a schedule (NKT_PROBE_INTERVAL, once a minute by default) nkt probes web server listeners and pool backends, published Docker and Podman ports, forwarded LXD ports, and running LXD instances and libvirt machines by ping at their address. On a Kubernetes control plane the cluster is probed too: Ingresses (an HTTP request with their host name through the ingress controller), NodePort and LoadBalancer services (a connection to the node port) and cluster nodes (ping). A probe is a TCP connection, an HTTP request with the right Host header, or a ping. The history turns into:
- a “weekday hour × downtime” heatmap — you see when a service fails regularly;
- availability and latency graphs for a period;
- a list of outages with start, end and the error text.
Besides the auto-discovered ones you can add your own targets with "+ target": ping, TCP, HTTP or HTTPS to any address, internal or external. Scans never touch your own targets; you delete them from the list.
Load
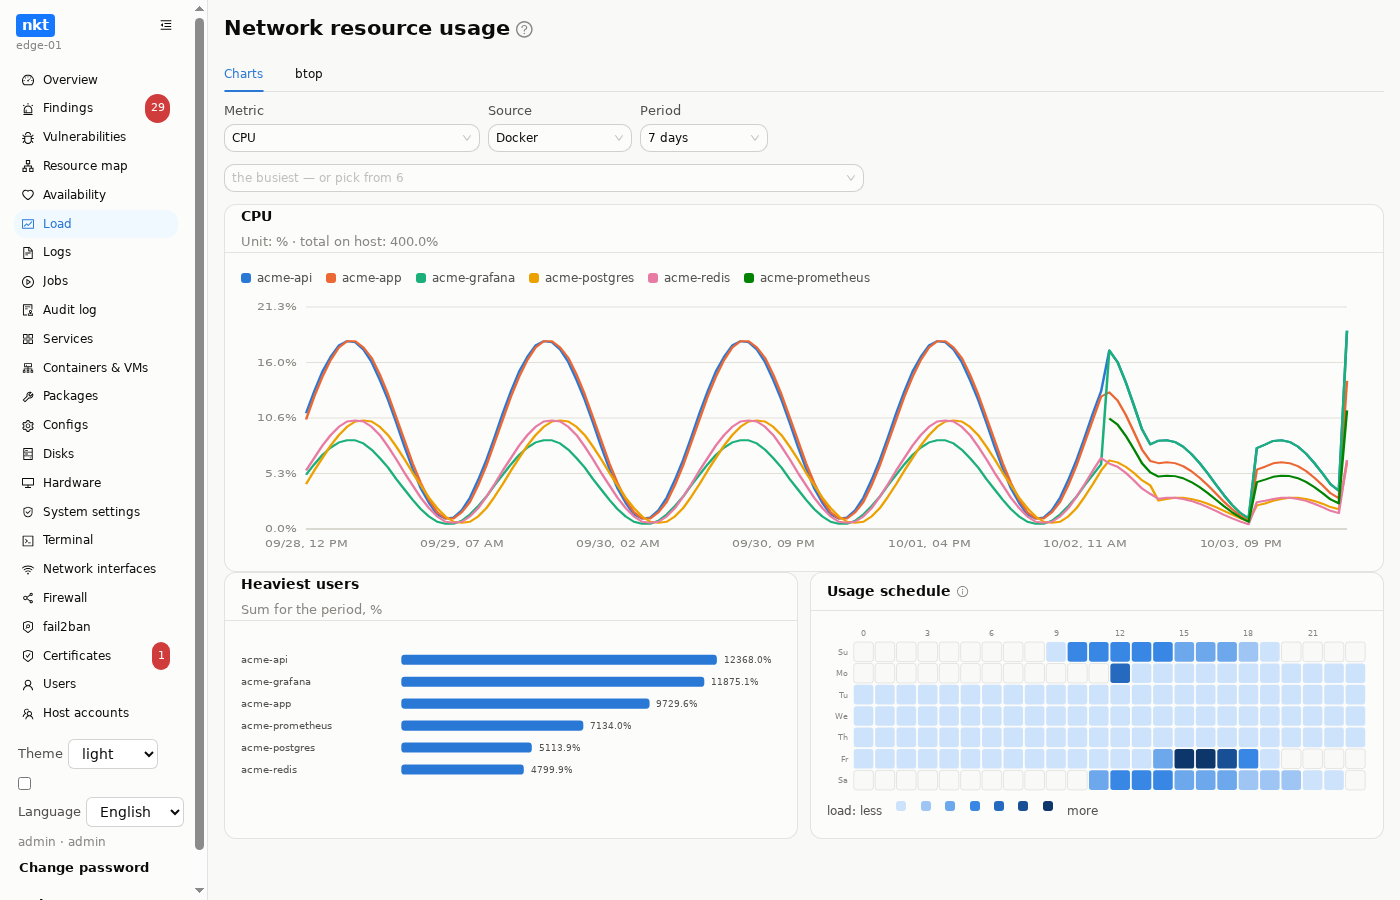
- Load graphs from iptables counters, nginx/haproxy access logs and the load of containers and machines for the chosen period: for network, CPU and memory you pick the source next to the metric — Docker, Podman, LXD, Libvirt (
virsh domstats) or Kubernetes (pods,kubectl top); log entries are sorted by their own timestamp, so the graph shows when the load happened, not when it was collected. - Metrics go by importance: CPU first and selected by default, then memory, then network and the rest. The default source is the first one with data for the last day (Docker → Podman → LXD → Libvirt → Kubernetes); sources without data are marked “no data”. The last source, Whole host, is the CPU and memory of the machine itself; it opens when the host has no container engines.
- Kubernetes has two sources: Kubernetes for pods and Kubernetes · nodes for cluster nodes, workers included (
kubectl top nodes). Pods can be filtered by nodes (several) and namespace. - Above the chart is an object picker: by default the busiest are drawn and the rest fold into “Other”; the searchable list lets you pick any, and “What is in “Other”?” opens it.
- Charts, the ranking and the schedule read hourly summaries kept as samples are written, not the per-minute samples: the page opens fast and does not hold the host's database (on a host with Kubernetes these queries used to take seconds, and the host could miss the hub's poll meanwhile). Per-minute samples are kept for three days, hourly summaries for at least 90 days (
NKT_RETENTIONif longer). The first start after the update builds the summaries from the existing history once. - A ranking of the busiest resources and a load schedule by hour.
- The btop tab — a live
btopin a terminal window; installed with a button if the host lacks it.
Logs
journald logs by unit and files from /var/log, including rotated and compressed ones. The unit list shows installed services only: a service missing from the host has no journal either. Live following over WebSocket with a filter, highlighting and autoscroll; the log window can be detached into a separate browser window.
Jobs
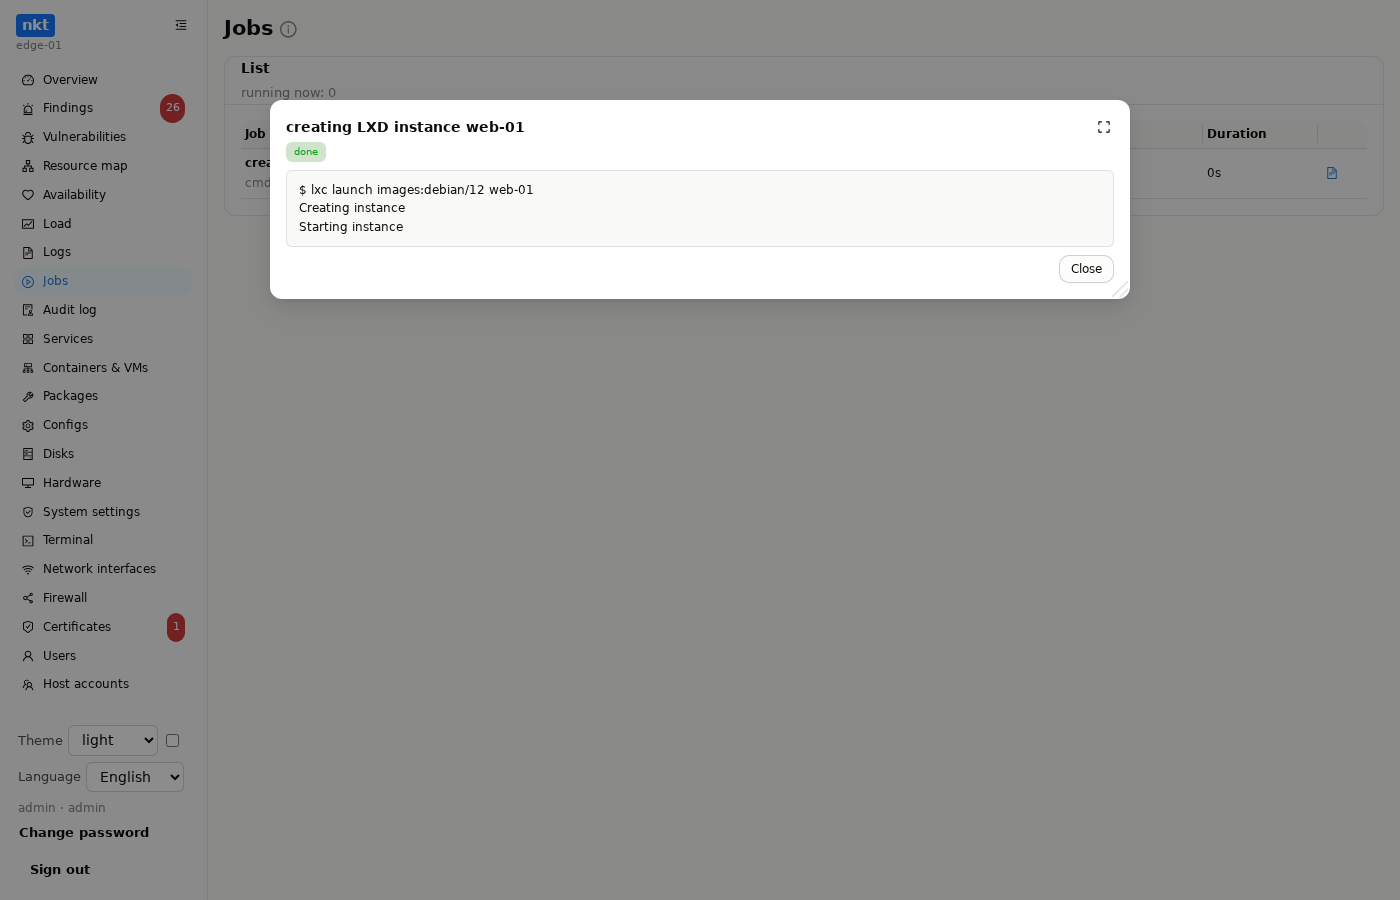
Everything long — installing packages, renewing a certificate, applying a profile, creating a machine — runs as a background job with a log, steps and cancellation. The host job list: kind, step, status, author, duration; the log is live. A job interrupted by a service restart resumes or is honestly marked interrupted.
The list works like the alert journal: filters by state and kind, a text search (the title and its arguments such as host names and addresses, the author, the step, the error) across all jobs rather than only the latest ones, pages of 20, 50 or 100, and date order by clicking "Started". The filter, page size and order are remembered in this browser. The hub's "Jobs" work the same way.
Jobs also cover installing and removing apt, snap and flatpak packages, the system upgrade, installing engines (LXD, Podman), btop, tmux, ufw and firewalld, creating LXD instances and Podman containers, downloading LXD images and changing guest passwords, stopping LXD instances and their snapshots, saving Docker images, uploading files from the computer, extracting an archive in the file browser, generating locales, deleting a user with the home directory, removing Kubernetes from a node, issuing and renewing a certbot certificate, scanning for vulnerabilities. On the hub — updating the hub itself, "Update all", starting and stopping nkt on all hosts, applying a manifest to clusters, deleting a host with cleanup, updating the vulnerability and ClamAV databases, collecting monitoring, scanning a host for vulnerabilities. Long host operations the hub calls from its own jobs (downloading and removing packages, removing Kubernetes, generating locales) run as host jobs too: their log is copied into the hub job's log. The button opens the job log window right away with percentages (apt's come from its status); a closed window reopens from "Jobs". Through the hub it is the same: these are the host's own jobs.
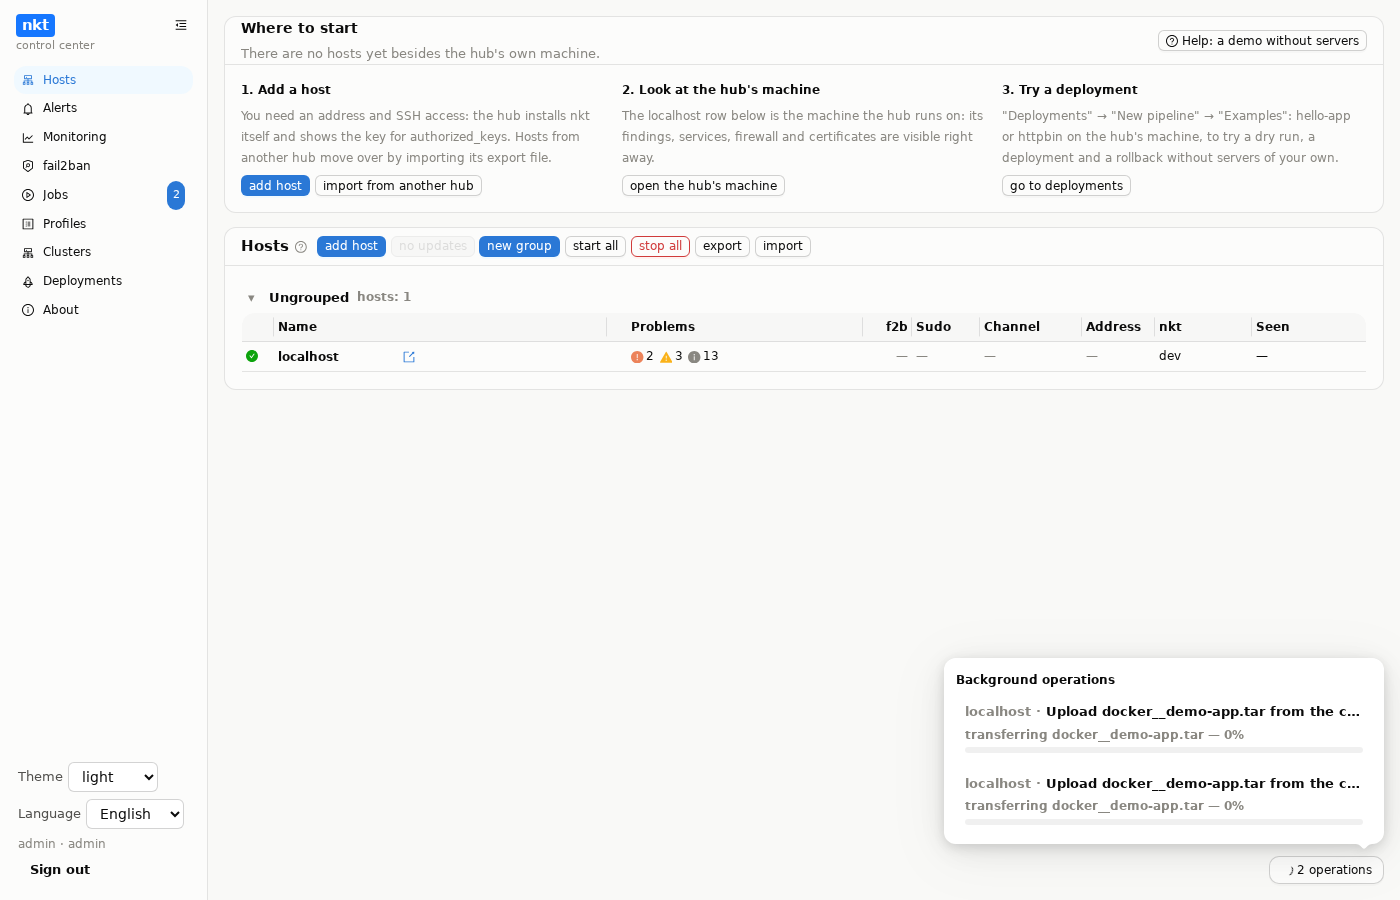
The background operations indicator — an "N operations" button in the bottom right corner of any section while something is running: on a host — its jobs, on the hub — the hub's own jobs and those of every online host (with the host name). The list shows the step and a percentage bar; a click opens the job log. This way a long operation's progress stays visible after leaving the section where it started, and from another host.
Audit log
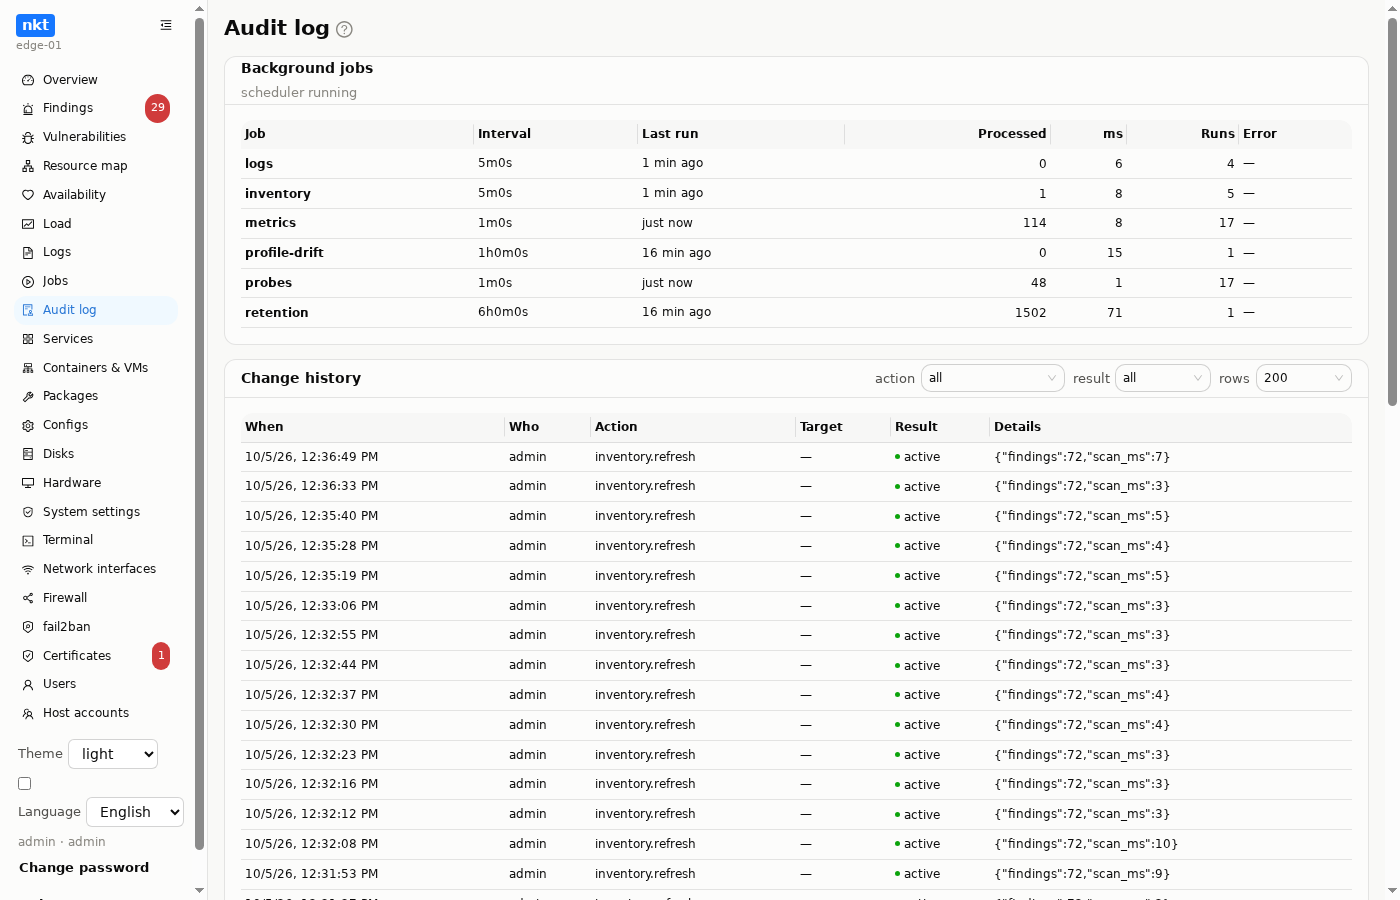
Every change through the UI and the API: who, what, when, with what result and command output; filters by action and result. The action kinds in the filter (clamav.*, fail2ban.*, system.*…) come from the log itself — the list holds exactly what has occurred on this host. The scheduler's background tasks are here too: interval, last run, how many processed, errors.