
Hub monitoring
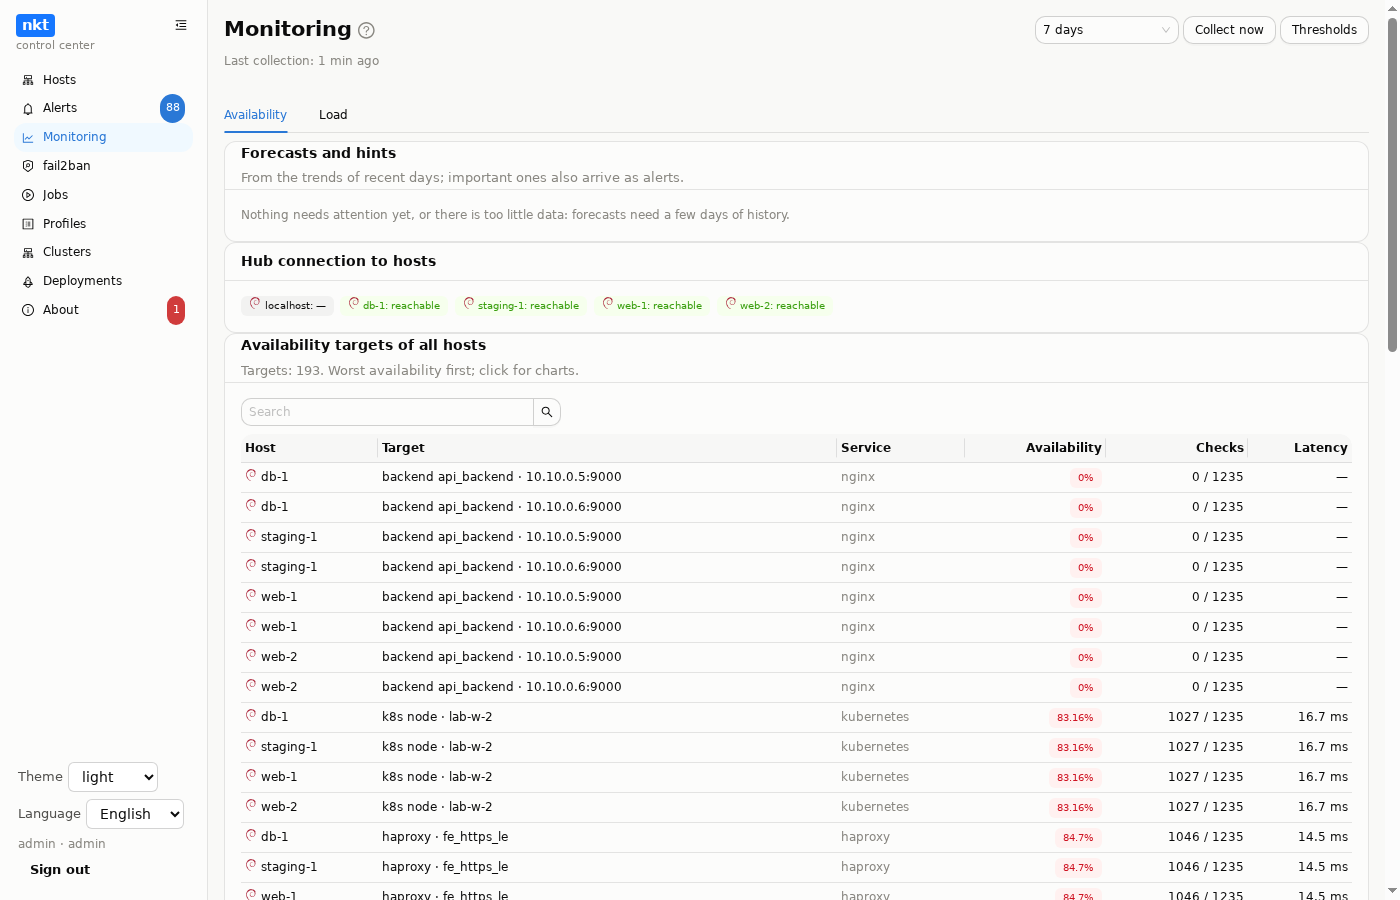
A hub menu section right below "Alerts": availability and load of all hosts with forecasts and hints. Two tabs, "Availability" and "Load"; at the top: the period (day, 7, 30, 90 days, year), "Collect now" and "Thresholds" (admin).
Where the data comes from. Every host records its own load series once a minute (CPU, memory, load, usage of each file system) next to the series of Docker and Podman containers, LXD, machines and Kubernetes pods and the availability target checks. Once an hour the hub pulls hourly summaries for the missing hours from each host (/api/monitor/summary; if a host was unreachable, the hub catches up while the host still has the data, up to 30 days) and keeps them: hours for 90 days, days for a year (NKT_HUB_HISTORY_HOURLY, NKT_HUB_HISTORY_DAILY). So the section shows hosts that are unreachable right now too. A host with an old nkt is marked "update nkt".
"Availability": the hub's connection to each host; all availability targets of all hosts with the percentage for the period, checks and latency (worst first, search, click for hourly or daily availability and latency charts); a downtime heatmap by hour of week in your local time.
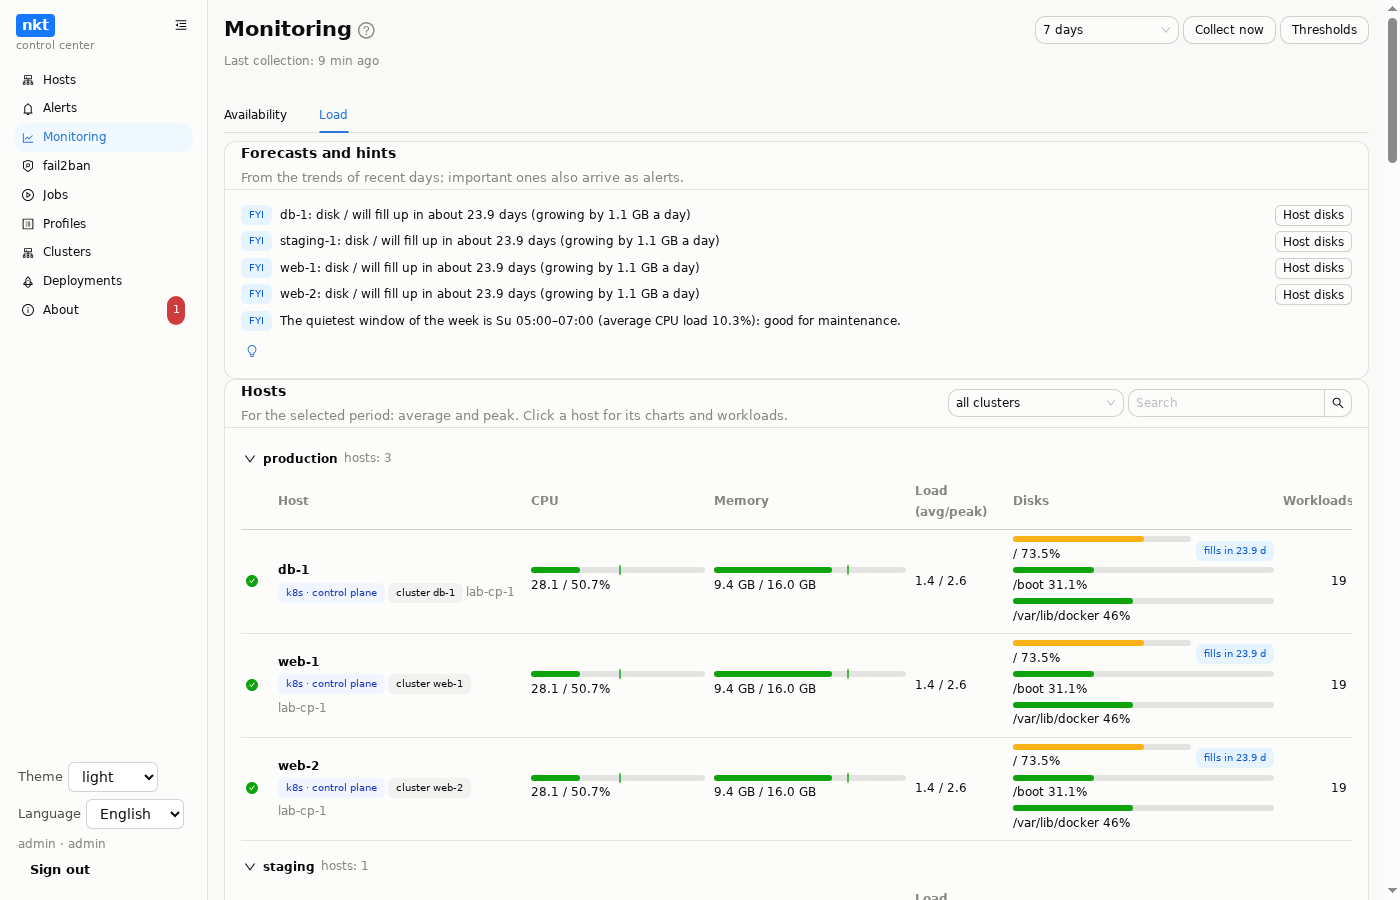
"Load": hosts look like the hub's host list: hub groups as collapsible sections, a status icon, CPU and memory as bars (the bar is the period average, the mark is the peak; the colour follows "Thresholds"), load, each disk as a bar with a "fills in N days" forecast; click for the host's charts (CPU, memory with a capacity line, load, disks in percent) and its workloads. A cluster filter and search.
Kubernetes. A control plane hands the hub the cluster layout: nodes with their role and the node of every pod. Hub hosts that are nodes are labelled "k8s · control plane" or "k8s · worker" with the cluster name (a node is matched to a host by address, then by name; hosts of clusters the hub created use their role in "Clusters"). Nodes that are not hub hosts get their own section "cluster … · nodes without a hub host" with readiness, address, CPU and memory from kubectl top nodes (share of the node's capacity).
Containers and machines of all hosts, each separately: Docker, Podman, LXD, libvirt machines, Kubernetes pods and Kubernetes nodes with CPU, memory and network; pods have a "Node" column (worker nodes show up as the nodes of their pods). Filters: kind, cluster, nodes (several), namespace, search; charts on click. A CPU heatmap by hour of week.
Forecasts and hints sit at the top of each tab, from the trends of recent days (a robust slope estimate, the median of the slopes of all point pairs, which single spikes do not move):
- a disk fills up in N days (from 14 days of history);
- host memory above the threshold for a whole day, CPU above the threshold on a daily average, memory or CPU growth week over week;
- memory of a container or machine keeps growing for several days, which looks like a leak;
- a target's availability over the day is clearly lower than over the week; latency has doubled;
- rebalancing: a host is out of memory while another has room, and which workload could move;
- the quietest window of the week (two hours with the lowest CPU load across all hosts) for maintenance.
Each hint has a button to the host section where it is handled ("Disks", "Containers and VMs", "Availability"); the hub changes nothing by itself. The light bulb under the list is model analysis: what matters more, what to do and what to watch next (its own "planning from Monitoring" instruction in the model analysis settings).
"Forecast" alerts: a disk fills up sooner than the threshold (warning and urgent), memory at its limit, a likely leak, a target availability drop. The same thing is not repeated until the situation changes; the "forecast" kind is switched on and off in the alert settings and goes to Telegram, Slack and outgoing webhooks like the others. "Thresholds" is a window with a diff before saving: days until a disk fills up for a warning and for urgent, the memory and CPU thresholds, days and growth for a leak, and the availability drop in percentage points.